Price history / Index · Updated October 10, 2026
Streaming Price Index 2026
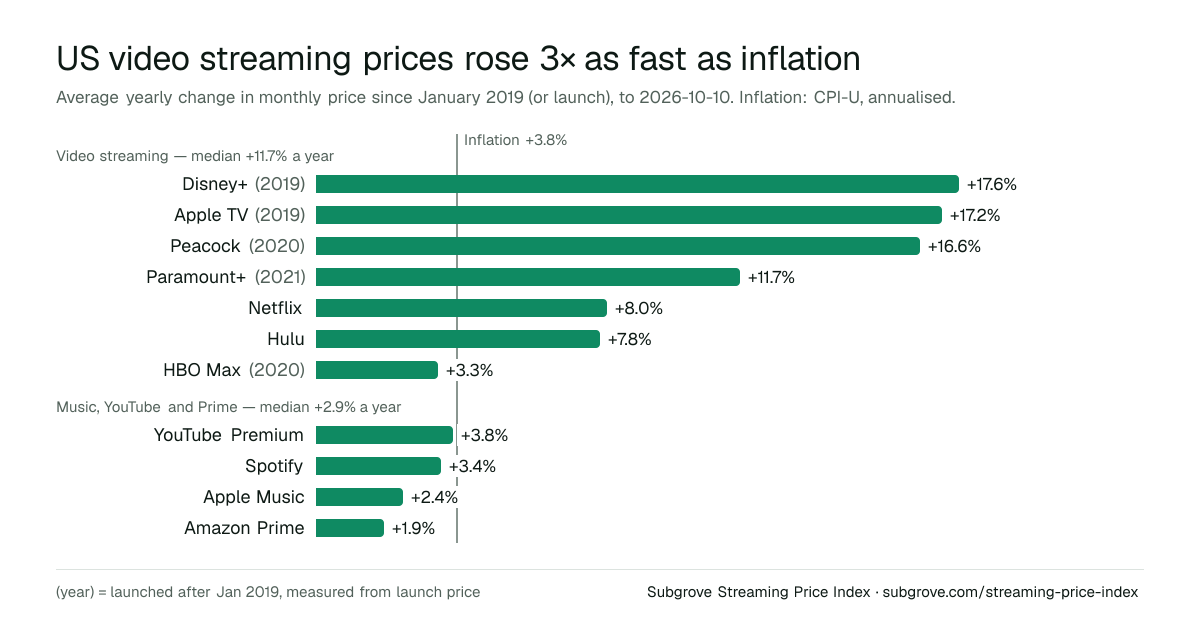
US video streaming prices have risen a median 11.7% a year since 2019 — 3× the pace of inflation. Music and Amazon Prime rose 2.9% a year, slower than prices overall.
Key findings
- Video streaming outran inflation. The median video service rose 11.7% a year, against 3.8% a year for consumer prices (CPI-U). Netflix ($10.99 → $19.99, +82%) and Hulu ($11.99 → $21.49, +79%) have risen about 2.4× as much as inflation (+33%) since January 2019.
- Disney+ has tripled since its 2019 launch: $6.99 → $21.49 a month, across 6 increases. HBO Max is the only video service that rose slower than inflation.
- Music and Prime lagged. YouTube Premium +33%, Spotify +30%, Apple Music +20% and Amazon Prime +15% since January 2019 — all at or below the +33% rise in consumer prices.
- The 2019 bundle costs +43% more. The 6 services that existed in January 2019 cost $67.94 a month together then and $97.44 now — $354.00 more a year.
- 38 price increases since 2019; 2026 has had the most (9), with the year not yet over.
Average yearly price rise since 2019, against inflation
Compound annual change in each service's US monthly price, from January 2019 or its launch. The yearly rate makes later launches comparable. Hover or tab to a bar for prices and dates.
Video streaming — median 11.7%
- Disney+(2019)
- Apple TV(2019)
- Peacock(2020)
- Paramount+(2021)
- Netflix
- Hulu
- HBO Max(2020)
Music, YouTube and Prime — median 2.9%
- YouTube Premium
- Spotify
- Apple Music
- Amazon Prime
(Year) = launched after January 2019, measured from its launch price. Inflation: CPI-U, January 2019–August 2026, annualised. Source: Subgrove Streaming Price Index, subgrove.com/streaming-price-index.
Price increases per year
Count of US price increases across the 11 services, by the year they took effect.
Every service, every number
| Service and plan | From | Now | Change | Per year | Rises |
|---|---|---|---|---|---|
| Disney+Premium (no ads; the original single plan before Dec 2022) | $6.99November 12, 2019 | $21.49 | +207% | +17.6% | 6 |
| Apple TVMonthly (formerly Apple TV+) | $4.99November 1, 2019 | $14.99 | +200% | +17.2% | 4 |
| PeacockPremium (with ads, monthly) | $4.99July 15, 2020 | $12.99 | +160% | +16.6% | 4 |
| NetflixStandard (ad-free) | $10.99Jan 2019 | $19.99 | +82% | +8.0% | 5 |
| Paramount+Essential (with ads, monthly; launched Jun 2021) | $4.99June 7, 2021 | $8.99 | +80% | +11.7% | 3 |
| HuluNo Ads, now Hulu Premium (monthly) | $11.99Jan 2019 | $21.49 | +79% | +7.8% | 5 |
| YouTube PremiumIndividual (monthly) | $11.99Jan 2019 | $15.99 | +33% | +3.8% | 2 |
| SpotifyPremium Individual | $9.99Jan 2019 | $12.99 | +30% | +3.4% | 3 |
| HBO MaxStandard (ad-free, monthly; HBO Max ad-free 2020, Max Ad-Free 2023, HBO Max Standard 2025) | $14.99May 27, 2020 | $18.49 | +23% | +3.3% | 3 |
| Apple MusicIndividual | $9.99Jan 2019 | $11.99 | +20% | +2.4% | 2 |
| Amazon PrimeMonthly membership | $12.99Jan 2019 | $14.99 | +15% | +1.9% | 1 |
Each service's page lists every change with its source. “Per year” is the compound annual rate over the period shown. For comparison, the CPI-U rose +33.1% from January 2019 to August 2026.
How to pay less for streaming
Streaming has no contracts, and the pricing assumes you'll subscribe once and never leave. Three habits turn that around:
- Rotate instead of stacking. Keep one or two services at a time and change which ones month to month. Subscribe, turn off auto-renew straight away — most services keep your access to the end of the paid month — watch what you came for, and move on. Four services at $15.85 (this index's average) is $63.40 a month; one at a time is a quarter of that. Wait for binge-released seasons to finish before subscribing.
- Use the ad tier for a binge month. Ad-supported plans are usually several dollars cheaper. Tolerating ads for one month is a different decision from tolerating them forever — but check what the cheap tier includes now, because features move between tiers.
- Know before it renews, and when it rises. Rotation fails for one reason: forgetting. Keep every service — active and paused — in one list with its renewal date and a reminder before each charge. Subgrove does that free for up to five subscriptions, and Pro warns you when a service you track raises its price, using the data on this page.
Methodology
- Prices: the standard US monthly price of one plan per service, followed through renames and tier splits (the plan shown in the table). Where a service introduced an ad tier, we track the ad-free plan that continued the original. Prices exclude tax.
- Dates:the date a new price took effect for new subscribers, from the company's announcement or contemporaneous reporting. Existing subscribers often moved one billing cycle later.
- Window: January 1, 2019 to October 10, 2026. Services launched later start at their launch price, so their change covers a shorter period — compare the “per year” column for a like-for-like rate. Headline figures use only the 6 services that existed in January 2019.
- Inflation: CPI-U, All items, U.S. city average, not seasonally adjusted (BLS series CUUR0000SA0), January 2019 (251.712) to August 2026 (334.98), from the Bureau of Labor Statistics.
- Sources:every price change links to its source on the service's price history page and in the CSV. Spot an error? Email hello@subgrove.com and we'll correct it and note the change.
Use this data
Free to use, including commercially, under CC BY 4.0. Please credit “Subgrove Streaming Price Index” with a link to this page.
Cite as
Subgrove, “Streaming Price Index 2026,” updated October 10, 2026, subgrove.com/streaming-price-index
Embed the chart
<a href="https://subgrove.com/streaming-price-index"><img src="https://subgrove.com/streaming-price-index/chart.png" alt="US streaming price rises since 2019 vs inflation — Subgrove Streaming Price Index" width="1200" height="630"></a>
Journalists: for comment or a cut of the data, email hello@subgrove.com.